AppDat’s Monitoring #
For tenants of AppDat’s Kubernetes based application hosting platform , the platform provides a managed instance of the Loki Stack launch installed into each Kubernetes cluster, with pre-configured Single-Sign On services integrated with the Identity Platform . The monitoring services are also pre-configured to provide full observability of all services deployed within the applicable kubernetes compute environment.
The monitoring services allow application developers to view all system telemetry logging outputs for their deployed services hosted within AppDat managed environments.
Monitoring system components #
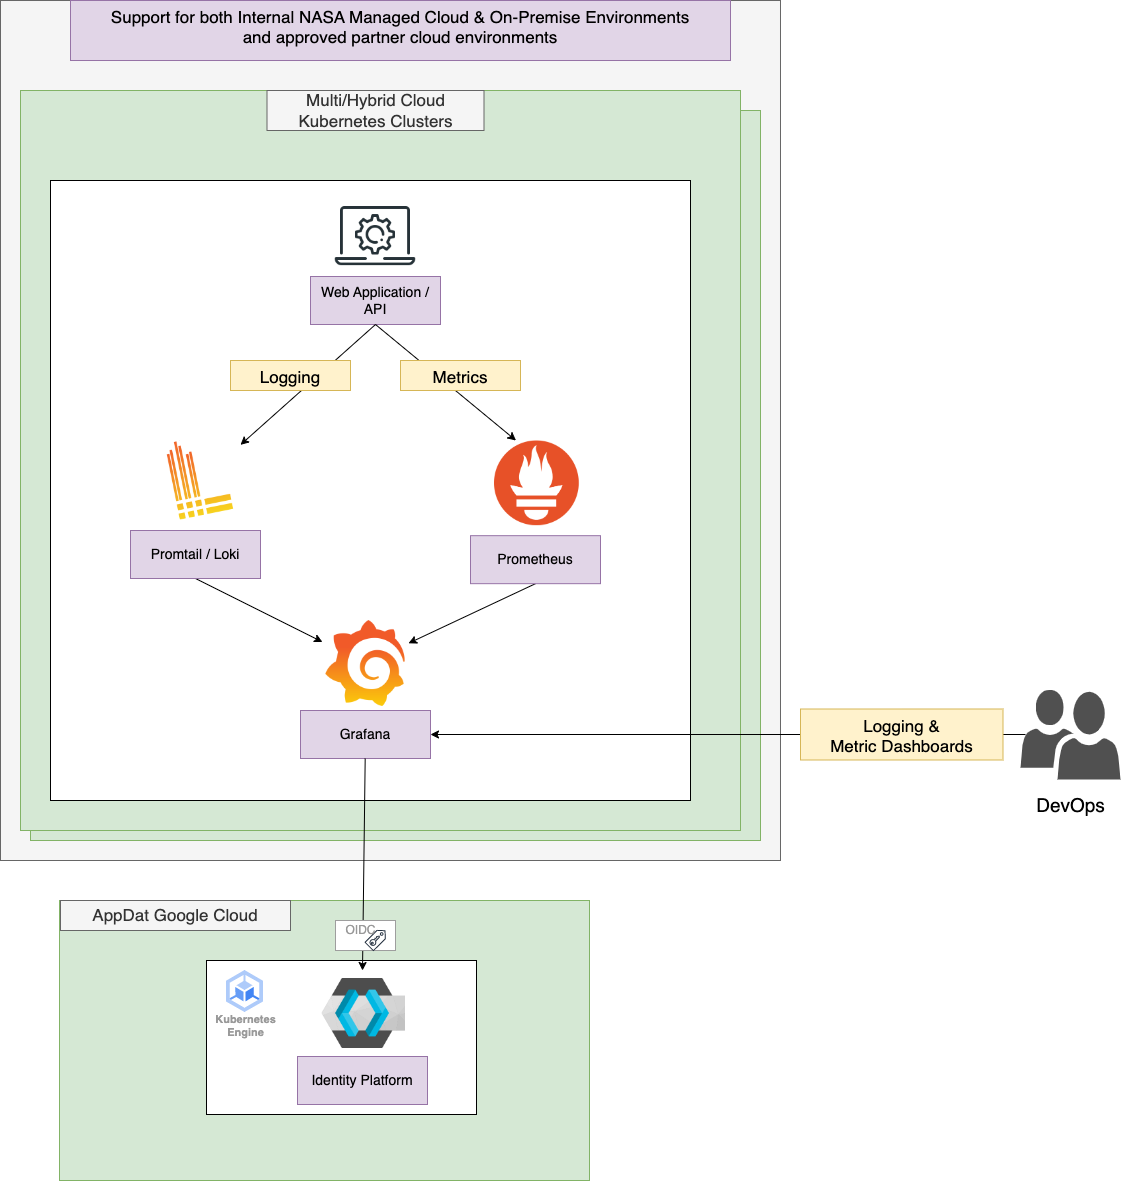
- Promtail - Responsible for capturing logging output from each resource deployed within the cluster, Promtail is a Kuberentes dameonset which runs on each node in the cluster.
- Loki - Responsible for aggregation of logging data from Promtail.
- Prometheus - Responsible for capturing all metric data from the resources deployed within the cluster.
- Grafana - Responsible for visualization of all logging and metric data.
Security Monitoring #
In addition to the tenant developer accessible monitoring dashboards provided via the Loki Stack, AppDat also manages the centralized collection and storage of application and system logs in accordance with the NASA security logging requirements.
For this function, the AppDat platform is integrated with the “Mission Cloud Platform” which provides the core cloud based security logging infrastructure and tooling.